How to Build an Offering Memorandum: The Modern CRE Broker's Template Guide
An offering memorandum (OM) is the marketing package a listing broker builds for a commercial property sale. It has three jobs: anchor the price, answer diligence questions before they are asked, and filter for real buyers. A modern OM has 12 sections, and its pricing summary, rent roll, and proforma must reconcile. Solsten CRE generates the OM from the underwriting model.
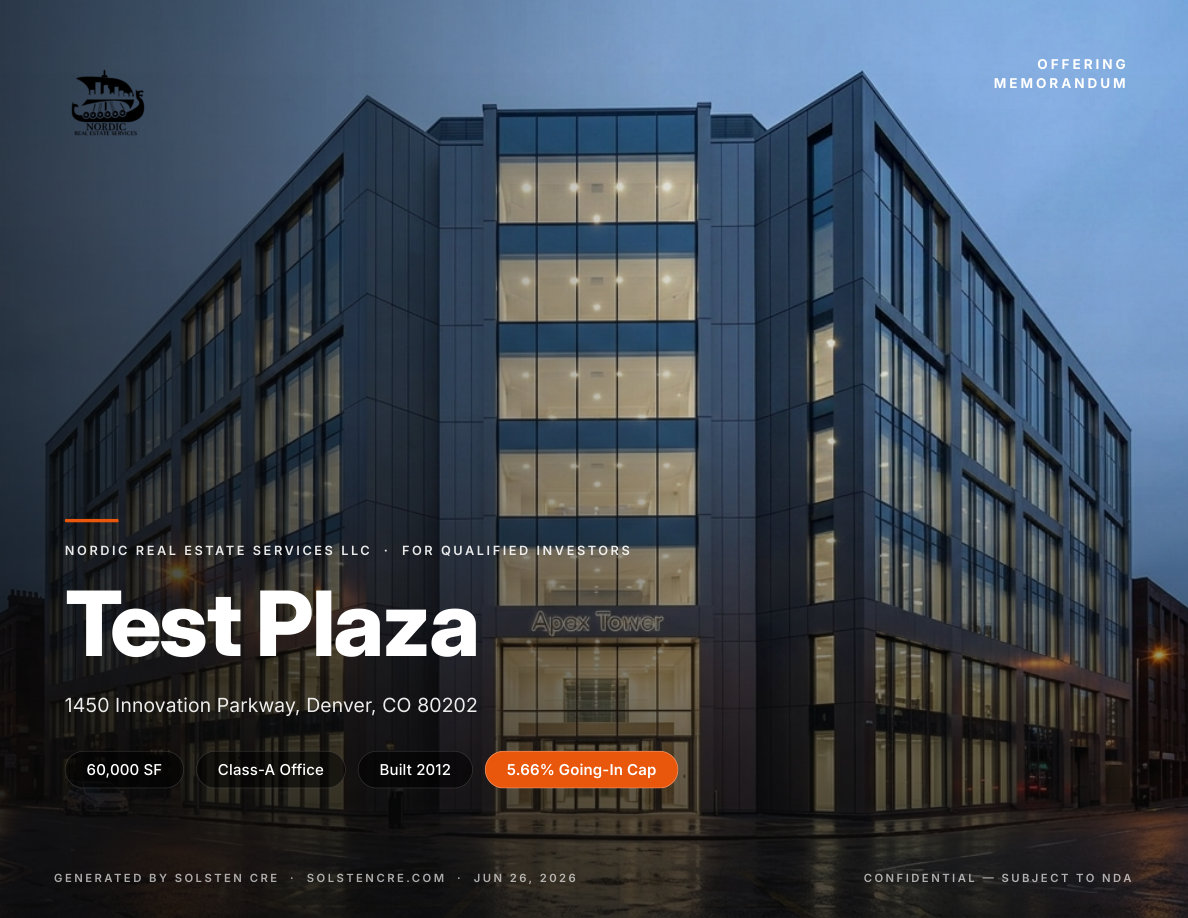
Every listing broker I have talked to has some version of the same problem: the offering memorandum takes forever, the template is always half a deal behind, and by the time it goes out the door the numbers already need updating.
The OM is the single most consequential document in a CRE listing. It is what shapes the first impression, sets the pricing anchor, and decides which buyers take the deal seriously. But most brokers are still building it the same way they built one in 2015 — a Word or InDesign template, a rent roll re-typed by hand, a proforma pasted in from a separate Excel file, and a demographics page that took an intern half a day to populate.
This guide walks through what a modern OM actually needs to contain, section by section, with screenshots from a real Solsten-generated OM on a fictional Denver office asset. Whether you build yours by hand, use a template, or generate it from a platform, the section structure is the same — and the standard buyers expect keeps rising.
What the OM Is Actually Doing
An offering memorandum has three jobs:
- Anchor the price. The buyer’s first read of your OM is the anchor for every subsequent negotiation. Undersell the deal and you leave money on the table. Oversell and you burn credibility with the broker community.
- Answer diligence questions before they are asked. The best OMs pre-empt the questions a serious buyer will ask on the first call. Weak OMs force the buyer to email back with basic questions — and every email is friction.
- Filter for real buyers. A well-built OM saves everyone time by helping tire-kickers self-disqualify early.
If your OM does not do all three, it is costing your seller money — either through a lower final price, a longer time on market, or lost buyer confidence.
The Modern OM Section Structure
Buyers now expect a consistent 10–12 section flow. Anything less looks amateur; anything more looks like padding. Here is the structure a serious institutional or private-equity buyer expects to see:
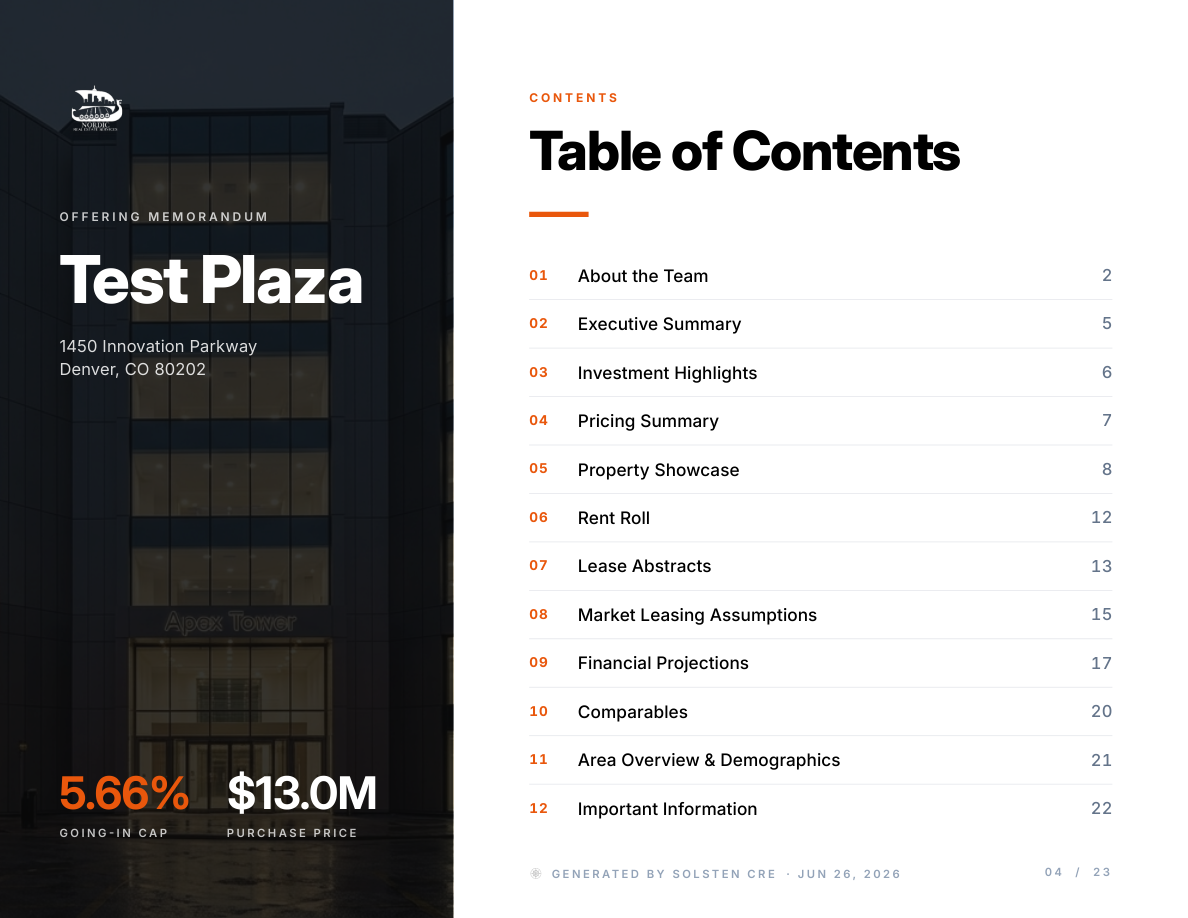
The 12 sections, in order:
- About the Team — who is selling this and why
- Executive Summary — the deal in one page
- Investment Highlights — the pitch, in bullet form
- Pricing Summary — offered price, cap rate, deal economics
- Property Showcase — photography, aerial, site plan
- Rent Roll — current tenancy, WALT, occupancy
- Lease Abstracts — one page per major tenant
- Market Leasing Assumptions — the go-forward proforma inputs
- Financial Projections — 5-year proforma + KPIs
- Comparables — sale and rent comps
- Area & Demographics — submarket, population, income
- Disclaimers — the legal back matter
If your current template is missing any of these, that is where a serious buyer will start pushing back. Let’s walk through the ones that matter most.
Section 4: The Pricing Summary — Where Most OMs Fall Short
The Pricing Summary is the page every buyer flips to first. It has to answer: what is being offered, at what price, and how does the debt work?
Most broker-built OMs stop at price, cap rate, and $/SF. That is the minimum. What buyers actually want is a suggested financing scenario table — three or four LTV bands with indicative coupons and DSCR — so they can benchmark the deal against their own capital stack before they even get on a call.
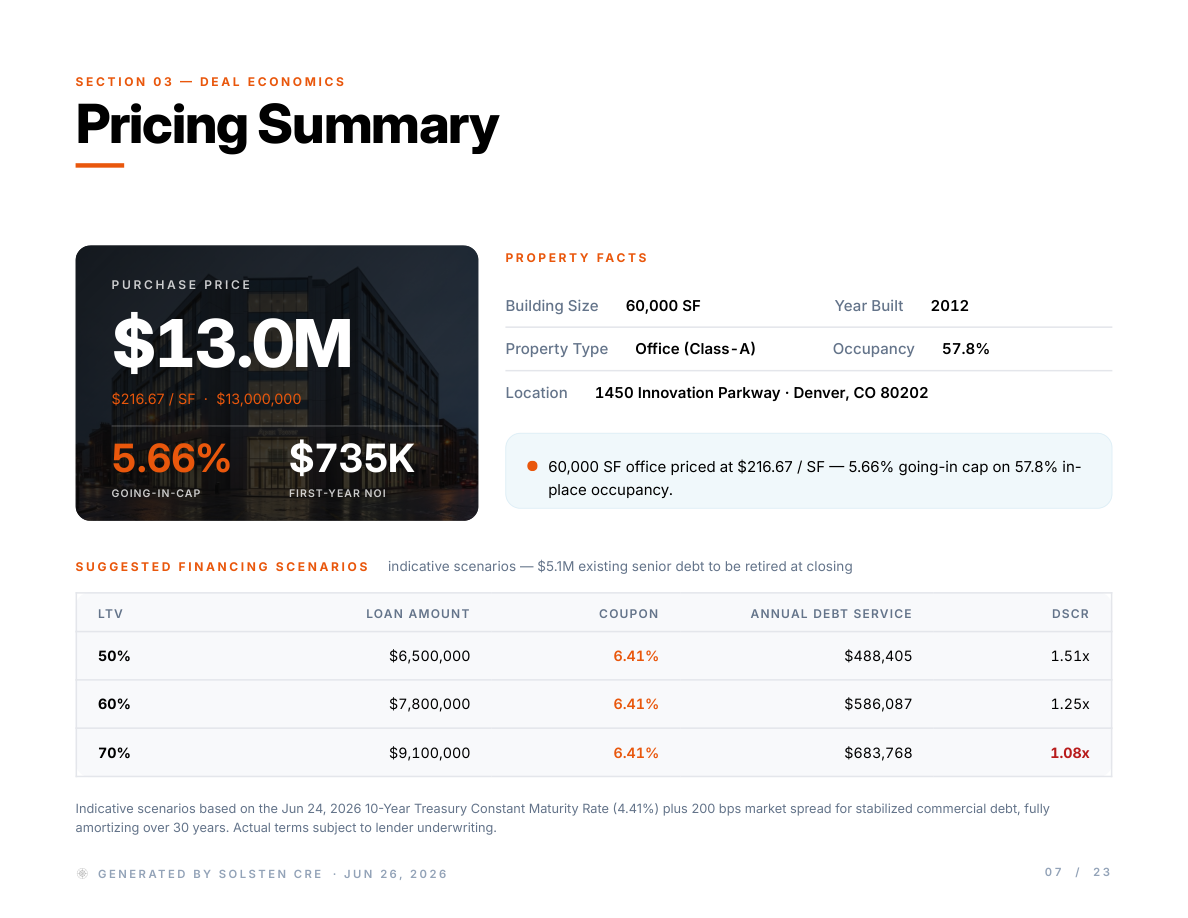
The screenshot above is from a Solsten-generated OM on a hypothetical 60,000 SF Denver office asset. Note what is on the page:
- Anchoring facts: $16.5M purchase price, 3.59% going-in cap on 57.8% in-place occupancy, $275.00/SF, first-year NOI of $593K (a value-add deal: the going-in figures are the empty-suite reality, the projections page carries the lease-up)
- Property facts row: size, year built, property type, occupancy, location
- Financing scenarios: 50%, 60%, and 70% LTV rows with loan amount, coupon, annual debt service, and DSCR
The financing scenarios are the piece most manually-built OMs skip. But they are exactly what a mid-market buyer needs to size the deal in the first 90 seconds. In Solsten’s OM builder, those coupons are anchored to the live 10-Year U.S. Treasury via FRED plus a documented spread — so the numbers reflect current market conditions rather than a stale template from six months ago.
This is one of the highest-signal upgrades a broker can make to their template: if the buyer has to compute DSCR themselves before they can react to your deal, you have lost half a beat of momentum.
Section 6: The Rent Roll — Where Broker OMs Get Caught
The rent roll is where the OM either earns credibility or loses it. Buyers can spot a hand-typed rent roll from three floors away — inconsistent formatting, missing WALT calculations, no clear line between contract rent and market asking rent for vacant suites.
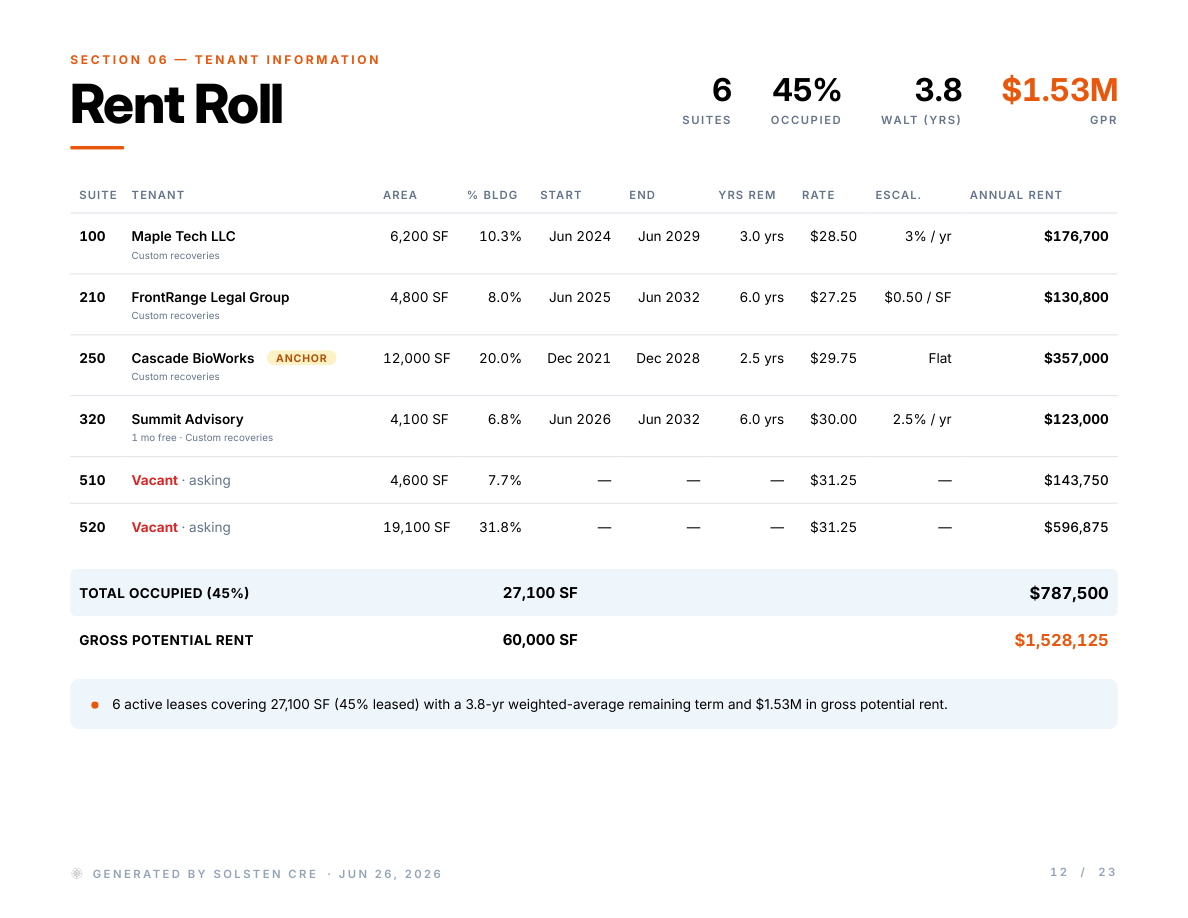
What a serious buyer wants to see on this page:
- The headline metrics up top: suite count, occupancy percentage, WALT, and gross potential rent
- Per-suite detail rows: tenant name, suite, area, lease start/end, years remaining, base rate, escalation, annual rent
- Anchor tenant flagged visually — the Cascade BioWorks row above is marked with an ANCHOR badge because 20% or greater share of the building warrants it
- Vacant suites priced at asking market rent, not left blank
- A footer totaling occupied SF and gross potential rent
If you are still building rent rolls by copy-pasting from the property manager’s spreadsheet, this is the section where switching to a data-driven builder pays for itself. Every one of the numbers on that screenshot is derived from the underlying lease data — WALT recalculates when you edit any lease, GPR reflects both current in-place rent and vacant-suite asking rent. There is no version drift because there is only one source.
For a deeper dive on what makes a rent roll actually useful for underwriting, see How to Analyze a Rent Roll.
Section 11: Demographics — The Section Everyone Underinvests In
Demographics is the section most brokers treat as filler. It is not filler. It is the answer to the question a buyer’s investment committee is going to ask: is this a real submarket, or am I buying into a shrinking one?
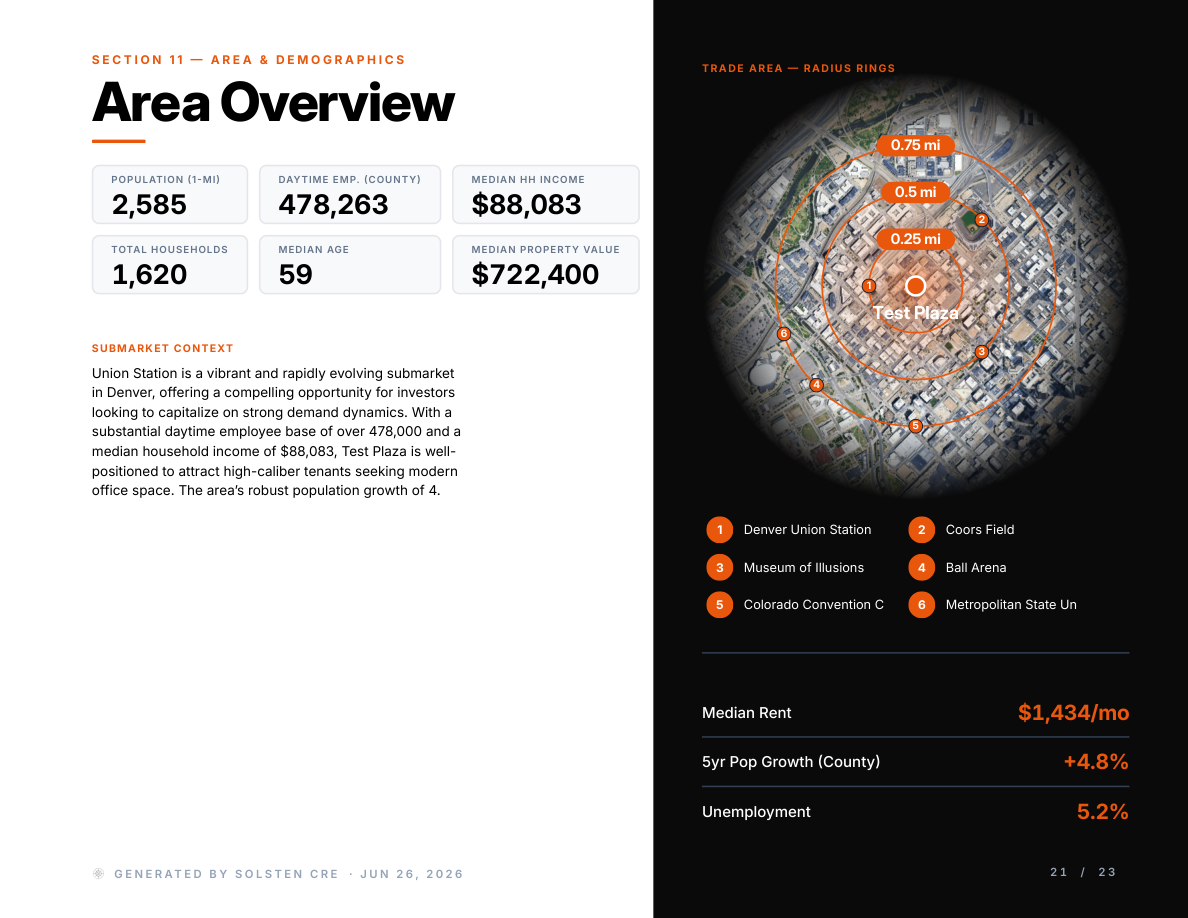
The screenshot above shows what a serious demographics page looks like. It answers, in one glance:
- Population within 1 mile — density signal
- Daytime employees — office/retail demand signal
- Median household income — buyer-quality signal for retail or multifamily; wealth-effect signal for office
- Total households + median age + median property value — the household-formation story
- Submarket narrative — a paragraph of context, not a copy-pasted Wikipedia paragraph
- Radius rings map — 0.25, 0.5, 0.75 mile visual on the property location
The public data behind those numbers (ACS 5-year estimates from the U.S. Census, County Business Patterns for daytime employment) is free — but pulling it, formatting it, and rendering the radius-ring map is what takes brokers half a day per OM. In a data-driven builder, this page populates automatically from the property’s latitude and longitude.
The Sections Buyers Skim (But That Still Have to Be Right)
Executive Summary + Investment Highlights — buyers spend under 30 seconds on these but treat them as a credibility check. If the bullet points don’t line up with the underlying numbers on the pricing page, buyers notice.
Property Showcase — professional photography matters more than most brokers admit. A poorly lit iPhone photo on the cover of an OM signals a poorly run listing.
Market Leasing Assumptions — this section tells the buyer whether your proforma is defensible or aspirational. The four numbers that matter: hold period, discount rate, exit valuation method, and rollover assumptions per tenant profile. Buyers who model deals seriously will re-underwrite from your Market Leasing Assumptions page. If the assumptions look like defaults from a 2019 template, expect a lowball offer.
Comparables — sale comps and rent comps, with the subject property clearly marked. Buyers do their own comp analysis, but they compare it against yours. Weak comps signal weak market knowledge.
Disclaimers — legally boilerplate but non-negotiable. Every OM needs a clear NDA reference, a user-supplied-content disclosure (for the comparables and market commentary sections), and a limitation-of-liability clause.
Where Broker-Built OMs Actually Break
I have looked at a lot of OMs over the last two years — from independent brokers, from national brokerage teams, and from platform-generated outputs. The failure patterns are consistent:
1. Version drift between the OM and the underwriting file. The broker updates the price in the proforma but forgets to update the pricing summary page in the OM. Or the rent roll changes but the WALT on the summary page still reflects the old number. Every serious buyer catches this within 10 minutes and it costs credibility immediately.
2. Financial projections that don’t match the rent roll. If your Year 1 base rental income doesn’t reconcile to gross potential rent minus vacancy, the buyer knows the OM was assembled from disconnected files. The moment a buyer sees a $50K discrepancy, they mentally add a 25 basis point cap-rate premium to protect themselves.
3. Stale financing assumptions. A DSCR row that assumes 5.5% coupons in a 7% rate environment tells the buyer this template is a year old. Every OM the same broker sends out looks the same because the template is not being maintained.
4. Demographics pulled from Wikipedia. Buyers can smell this. Public data is free and current — there is no excuse for a “Union Station is a vibrant neighborhood” paragraph with no supporting numbers.
5. Missing the buyer’s next question. Weak OMs answer the questions the broker wants to answer. Strong OMs answer the questions the buyer will ask. That is the difference between an OM that generates offers and one that generates emails.
The underlying issue in all five failure modes is the same: the OM was built from disconnected sources. A price change in one file does not propagate to any of the others. If you want the underlying case for connected underwriting more broadly, see Load-Bearing Math: Where AI Belongs in CRE.
What “Data-Driven” Actually Means for OMs
The alternative to the copy-paste template workflow is not “AI writes your OM.” It is a system where the OM is a rendered view of a live underwriting model, not a separate document.
That means:
- The rent roll page reads from the same lease records that feed the proforma
- The pricing summary shows the same NOI the financial projections page shows
- The financing scenarios use current market inputs, not template defaults
- The demographics page derives from the property’s actual coordinates
- Every page carries a “Generated on [date]” footer so the buyer knows how fresh the data is
When any of that changes, every downstream section updates. There is no “did we push this version to the buyer or the old one” moment. This is the architecture behind Solsten’s OM builder — the same underwriting file that produces the proforma also produces the OM.
What This Buys the Listing Broker
Brokers who have moved to a data-driven OM workflow report three things:
First, faster turnaround. The first OM on a new listing goes from a week of assembly to under an hour. Regeneration on price or assumption changes is essentially free.
Second, better positioning credibility. When the rent roll, financials, and pricing summary all reconcile, buyers stop looking for errors and start engaging with the deal.
Third, less internal review overhead. The senior broker doesn’t have to check whether the analyst updated the pricing page after changing the proforma — because there is only one source of truth.
None of this is magic. It is just the same shift from disconnected spreadsheet workflows to connected data models that acquisition teams made five years ago, finally coming to the listing side.
Final Takeaway
The OM template you use is a strategic asset. It is the single artifact your seller judges you on, the single artifact buyers judge the deal on, and the single artifact that determines how much time your team spends on marketing versus new business.
If your current template has all 12 sections, is being maintained against current market inputs, and reconciles across the pricing, rent roll, and proforma pages — you are ahead of most of the market. If any of those are broken, that is where to invest first.
For a specific look at what an end-to-end connected workflow looks like — from underwriting file to OM output — see Solsten’s OM builder or the broader CRE underwriting software page.
Related Reading
Try Solsten Free
See everything we discussed in action — no credit card required.
Start Your Free AnalysisRelated Articles
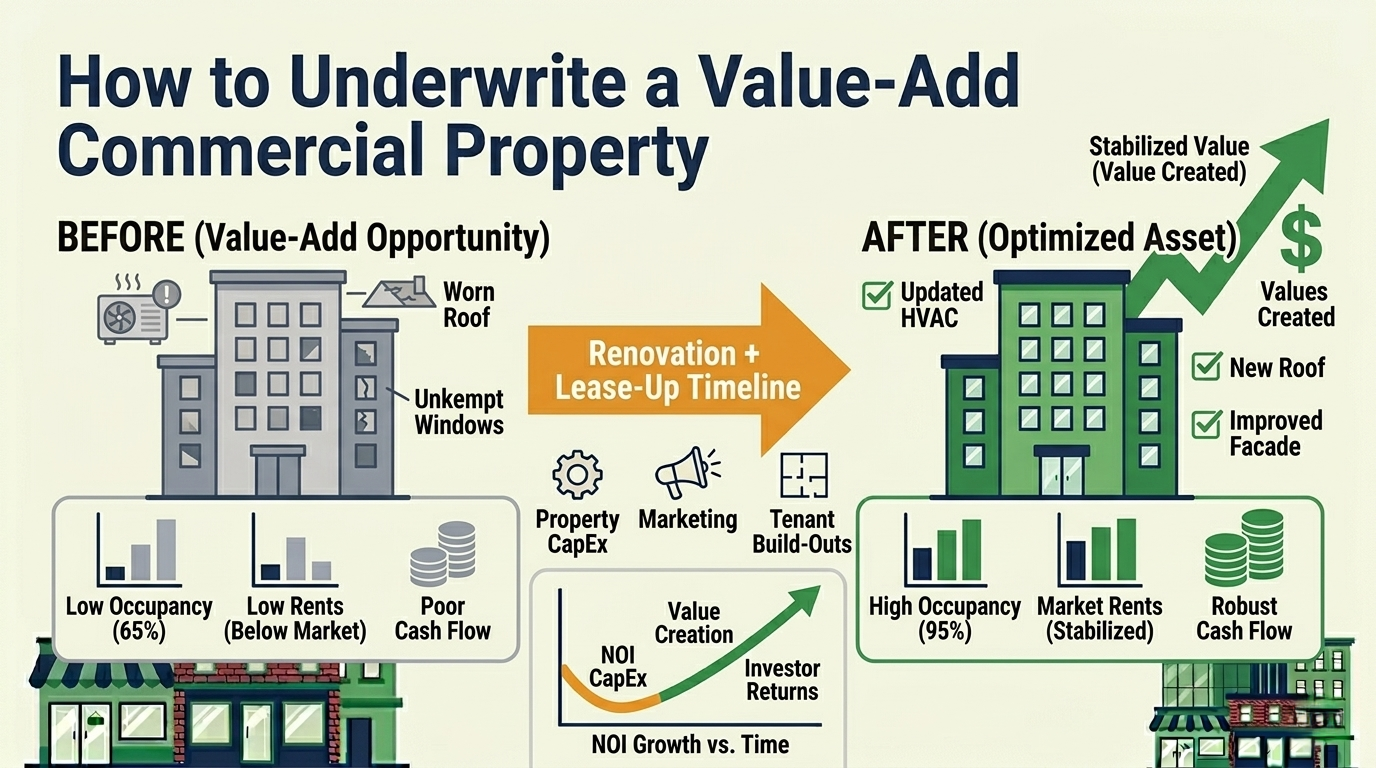
How to Underwrite a Value-Add Commercial Property
Step-by-step guide to underwriting value-add commercial real estate — how to model renovation costs, lease-up timelines, rent bumps, and calculate risk-adjusted returns for repositioning deals.
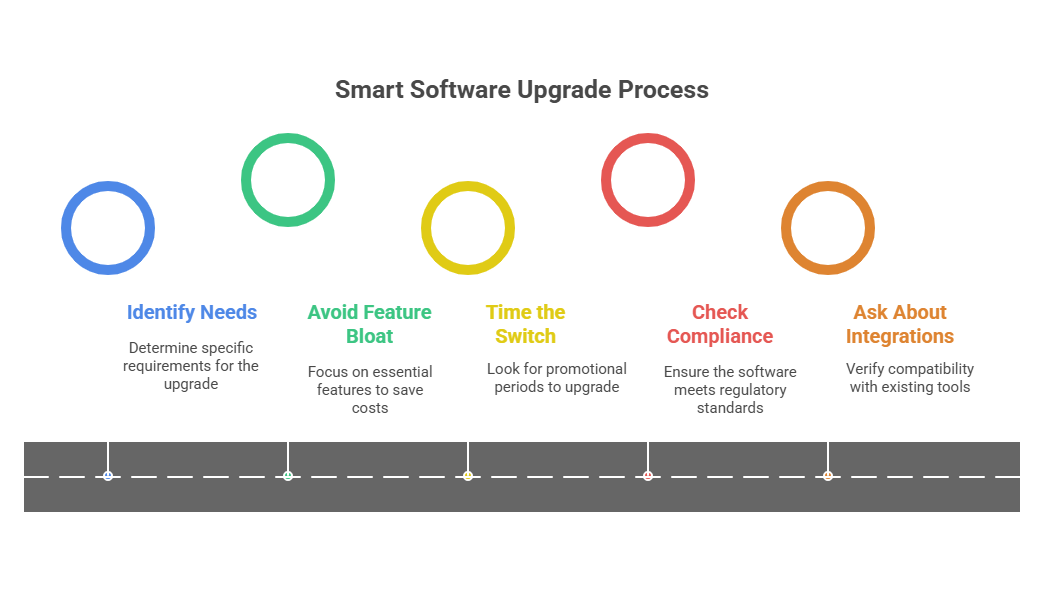
ARGUS Enterprise End of Life: Every Date, and What Each One Actually Means
ARGUS Enterprise version 13 comes off ARGUS Cloud on 31 December 2026. Here are the dates Altus published, what each one changes in practice, and what your options are if you are still on it.
ARGUS vs Solsten: A Feature-by-Feature Comparison for CRE Professionals
Detailed feature-by-feature comparison of ARGUS Enterprise and Solsten for CRE analysis. See where each platform excels, pricing differences, and which is right for your workflow.