Commercial Real Estate Cash Flow Analysis: From NOI to Cash-on-Cash
Commercial real estate cash flow is the money a property returns to its owners after operating expenses, debt service, and reserves. It is calculated top down: potential gross income, less vacancy, plus recoveries, gives effective gross income; less operating expenses gives NOI; less debt service and reserve contributions gives cash available for distribution. Solsten CRE reports every line annually and monthly for each year of the hold.
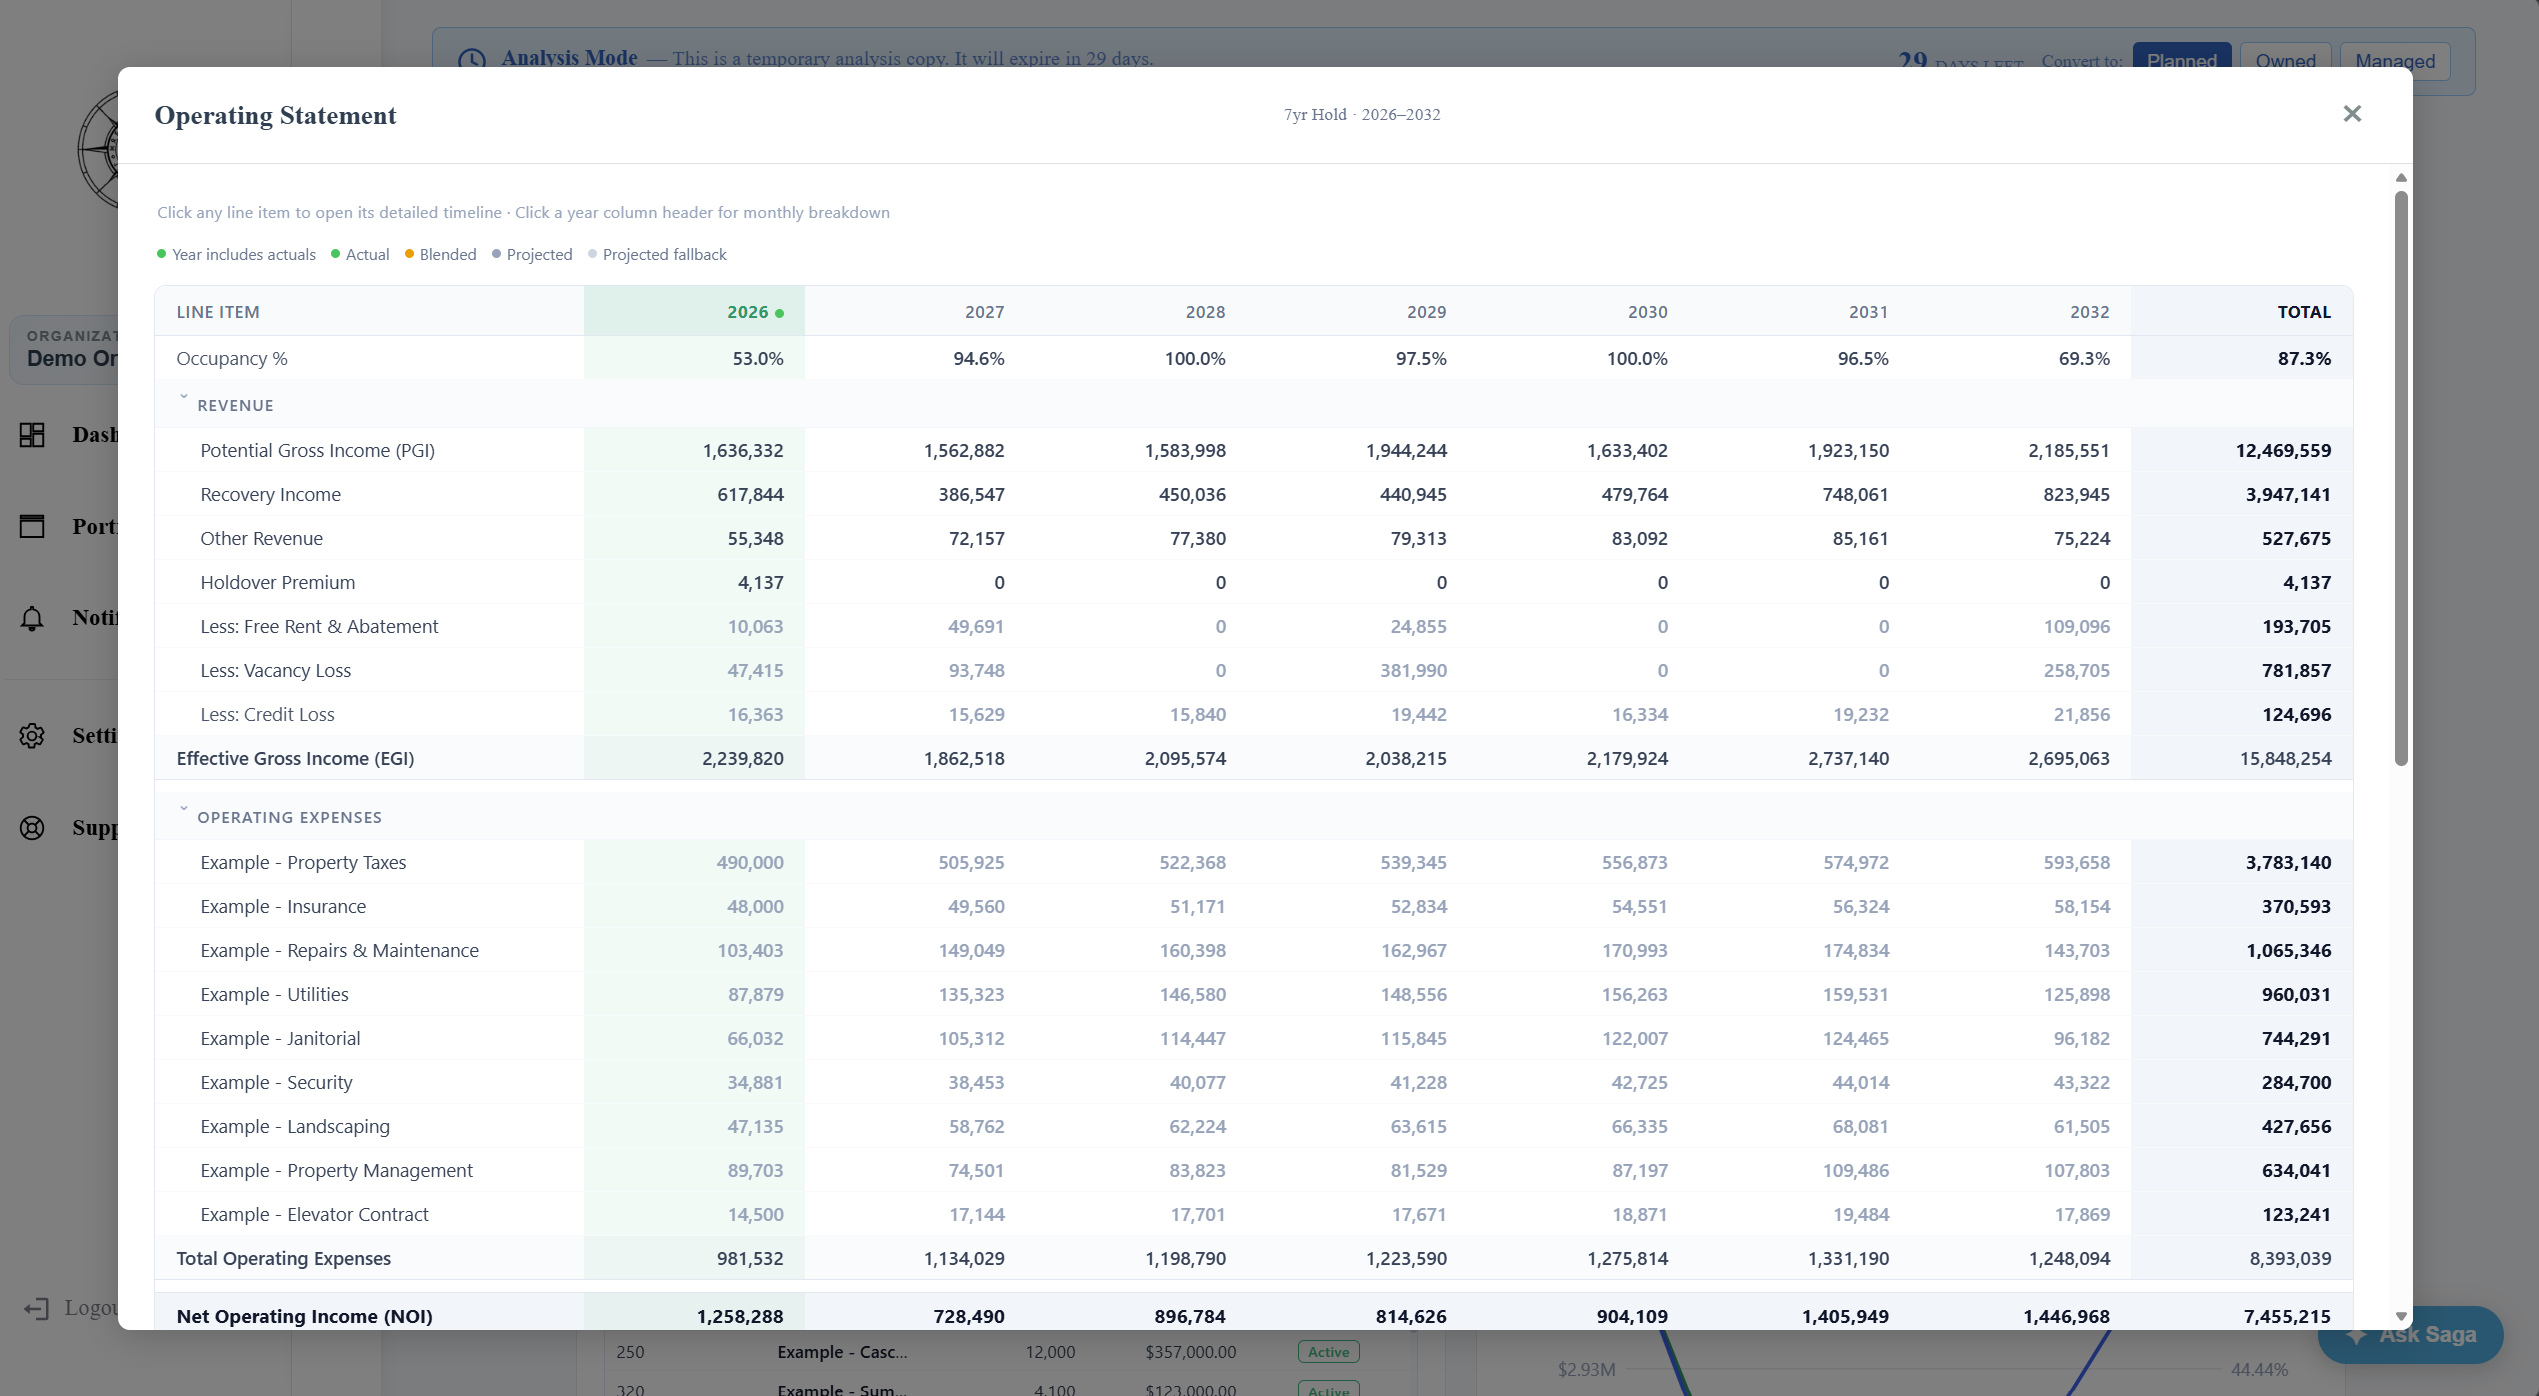
Net operating income tells you what a building earns. Cash flow tells you what you get to keep. Most of the surprises in commercial real estate ownership live in the gap between the two: a loan payment that does not move when occupancy does, a tax bill that lands in one month, a tenant improvement package that empties the reserve the year before a refinance.
This guide walks the full ladder from potential gross income to cash available for distribution, works a complete example with debt and reserves, shows why the monthly view matters, and lists the five mistakes that make a deal look better on paper than it will in the bank account.
The Cash Flow Ladder
Every commercial property operating statement follows the same sequence. The names vary slightly by shop; the order does not.
| Line | What it is |
|---|---|
| Potential Gross Income (PGI) | Every suite at its contract rent, vacant suites at market rent, for the full period |
| Less: vacancy and credit loss | Downtime between tenants, free-rent periods, uncollected rent |
| Plus: recovery income | Operating expenses billed back to tenants under NNN, base-year stop, or modified gross leases |
| Plus: other income | Parking, storage, signage, late fees |
| Effective Gross Income (EGI) | The revenue you actually collect |
| Less: operating expenses | Taxes, insurance, repairs and maintenance, utilities, management, and the rest |
| Net Operating Income (NOI) | The building’s income before financing |
| Less: debt service | Principal and interest on every loan on the property |
| Cash flow after debt service | The lender’s view of what is left |
| Less: reserves and capital items | Replacement reserves, tenant improvements, leasing commissions, capital calls |
| Adjusted cash flow for distribution | The investor’s view: what can actually be paid out |
Two things to notice. First, everything above NOI is about the building and its leases. Everything below NOI is about how you bought it. Second, the ladder has two bottoms. Lenders stop at cash flow after debt service because that is what covers their payment. Investors keep going, because a reserve contribution is money that cannot be distributed even though it is still “in the deal.”
A Worked Example
Take a 20,000 square foot multi-tenant office building purchased for $4,000,000.
Revenue to NOI
| Line | Amount |
|---|---|
| PGI: 20,000 SF at $22.00/SF | $440,000 |
| Less: vacancy and credit loss at 7% | ($30,800) |
| Plus: recovery income | $45,000 |
| Plus: other income | $6,000 |
| EGI | $460,200 |
| Less: operating expenses | ($175,000) |
| NOI | $285,200 |
NOI of $285,200 on a $4,000,000 price is a 7.13 percent cap rate. That is the number the broker leads with, and it is the last number on the statement that has nothing to do with your loan.
NOI to cash flow
Finance 65 percent of the price: a $2,600,000 loan at 7.00 percent with 25-year amortization. The monthly payment on those terms is about $18,376, so annual debt service is about $220,500.
A 1.29x coverage ratio clears the 1.20x to 1.25x minimum most lenders apply, with a little room. Debt yield (NOI divided by the loan amount) is 10.97 percent, also comfortably inside typical lender ranges.
| Line | Amount |
|---|---|
| NOI | $285,200 |
| Less: debt service | ($220,500) |
| Cash flow after debt service | $64,700 |
| Less: replacement reserve at $0.25/SF | ($5,000) |
| Adjusted cash flow for distribution | $59,700 |
Cash flow to return
Equity is the price less the loan plus closing costs. At 2 percent closing costs:
So a 7.13 percent cap rate becomes a 4.03 percent cash return once the loan and the reserve are in the picture. That is not a bad deal or a good one; it is what 65 percent leverage at a 7 percent coupon does to a 7.13 percent cap rate. The spread between the cap rate and the loan constant is thin, so the debt is barely accretive to the cash return in year one.
Why Leverage Makes Cash Flow Fragile
Rerun the example with operating expenses 10 percent higher than underwritten: $192,500 instead of $175,000. NOI drops to $267,700, a 6.1 percent decline. Debt service does not move.
| Underwritten | Expenses +10% | Change | |
|---|---|---|---|
| NOI | $285,200 | $267,700 | -6.1% |
| Debt service | $220,500 | $220,500 | 0% |
| Cash flow after debt service | $64,700 | $47,200 | -27.0% |
| Adjusted cash flow for distribution | $59,700 | $42,200 | -29.3% |
| Cash-on-cash | 4.03% | 2.85% | |
| DSCR | 1.29x | 1.21x |
A 6 percent miss on NOI is a 29 percent miss on distributable cash flow, and the DSCR is now sitting on the lender’s covenant. This is the whole reason cash flow analysis exists as a separate discipline from NOI analysis: the loan turns small operating misses into large equity misses. The more leverage, the sharper the multiplier.
The same arithmetic runs the other way. If you can push NOI up 6 percent through recoveries or expense control, distributable cash flow rises almost 30 percent. That asymmetry is why value-add underwriting lives or dies on the expense assumptions, not the rent assumptions.
Annual Is Not Enough
The example above is an annual statement, and annual statements hide the months. Consider how the same building actually pays its bills:
- Property taxes of $60,000 are paid in two installments, January and July.
- Insurance of $12,000 renews in August.
- A 5,000 square foot tenant’s lease expires in June, with two months of downtime and a one-month free-rent concession on the new lease.
Average monthly NOI is about $23,800, comfortably above the $18,376 loan payment. But in January and July, a $30,000 tax installment lands in a single month. Monthly EGI is about $38,350 and the other expenses run about $8,600 a month, so NOI in a tax month is roughly zero, and the loan payment is still due. The owner funds roughly $18,500 from the operating account or from reserves, twice a year, on a building whose annual cash flow is positive.
Add the summer rollover and the second half of the year has two months with no rent from a quarter of the building, followed by a free-rent month, followed by the tenant improvement check. A building that shows $59,700 of annual distributable cash flow can have four or five months where the owner is writing checks rather than receiving them.
This is why institutional operating statements are monthly, why lenders ask for monthly operating history, and why an underwriting model that only produces annual columns will approve deals that a monthly model would flag. If your projection cannot show you the month where cash goes negative, it is not showing you the risk.
Cash Flow Over the Hold
A single year is a snapshot. The actual analysis covers every year of the hold, because the things that break cash flow are scheduled events:
- Lease rollovers. Each expiration brings downtime, re-leasing costs, and possibly a different rent. A rent roll where 40 percent of the income expires in year three is a year-three cash flow problem, however good year one looks.
- Loan events. Interest-only periods end and amortization starts; the payment jumps. Floating rates reset. Balloon maturities inside the hold force a refinance at whatever the market offers that year.
- Capital projects. Roof, parking lot, HVAC, and tenant improvement programs are lumpy and large. They come out of reserves or capital calls, and they show up below NOI, where the cap rate cannot see them.
- Expense inflation versus rent escalation. If expenses grow at 3 percent and a long lease escalates at 2 percent, NOI margin compresses every year until rollover, and recoveries on a base-year lease absorb only part of the gap.
A proper cash flow projection models each of these in the year and month they occur, then reports cash-on-cash, DSCR, and debt yield for every year, not just year one. The guide to building a real estate proforma covers the construction step by step.
Cash Flow Versus Total Return
Operating cash flow stops at the hold period. Total return adds the reversion: the sale price at an exit cap rate, less selling costs and the loan payoff. Two metric families come out of this:
- Cash-on-cash uses operating cash flow only. It answers “what does this pay me each year while I own it?”
- IRR and equity multiple use operating cash flow plus the reversion. They answer “what does the whole investment return, including the sale?”
The two can disagree sharply. A value-add deal might show negative cash-on-cash for two years and a 20 percent IRR, because the return is in the sale. A stabilized net-lease asset might show 6 percent cash-on-cash and a 7 percent IRR, because almost nothing is happening but the coupon. Neither is wrong; they measure different things, and an investor who needs current income should not be sold on the IRR. The guide to IRR and NPV goes deeper on the total-return side, and cash-on-cash return on the income side.
Five Mistakes That Flatter the Cash Flow
- Typing in debt service instead of calculating it. A round-number loan payment ignores the interest-only period that ends in year three and the rate reset in year five. Build the debt from the loan terms and let the schedule produce the payment.
- Leaving reserves above the line or out entirely. Replacement reserves are not an operating expense and should not reduce NOI (lenders will add them back anyway), but they absolutely reduce distributable cash. Deals that skip them overstate cash-on-cash by the full reserve.
- Smearing vacancy as a percentage. A 7 percent vacancy factor across every year produces a smooth line that has never happened on any real building. Model each lease expiration with its own downtime and you will find the year where vacancy is 25 percent.
- Forgetting leasing costs at rollover. Tenant improvements and leasing commissions on a renewal or new lease are often a full year of that suite’s rent. They hit cash flow in the rollover year, below NOI, invisible to the cap rate.
- Using the seller’s expenses. A trailing twelve-month statement reflects the seller’s tax assessment, insurance program, and deferred maintenance. Reassess taxes at your purchase price, re-quote insurance, and normalize repairs. The guide to reading a T-12 covers each adjustment.
How Software Changes the Analysis
None of the arithmetic above is hard. What is hard is keeping it current. The loan schedule, the rent roll, the expense history, and the reserve balance all change, and a spreadsheet built at acquisition is usually abandoned by the first quarterly report.
Purpose-built commercial real estate cash flow software keeps the ladder intact: debt service comes from the loan schedules, vacancy comes from each lease’s expiration date, reserves adjust the distributable line, and the same model that produced the underwriting produces the monthly statement after closing, with actuals recorded against the projection. The analysis does not get more sophisticated; it gets done every month instead of once.
Key Takeaways
- Cash flow is NOI minus debt service minus reserves and capital items. NOI describes the building; cash flow describes the investment.
- Leverage multiplies operating misses: in the example, a 6 percent NOI shortfall became a 29 percent cash flow shortfall.
- Annual statements hide the months where taxes, insurance, and rollovers push NOI below the loan payment. Model monthly.
- Project every year of the hold, because the events that break cash flow (rollovers, loan resets, capital projects) are scheduled, not random.
- Cash-on-cash and IRR measure different things. Match the metric to what the investor actually needs.
Related Articles
- What Is NOI in Commercial Real Estate? - The top half of the ladder, line by line
- Cash-on-Cash Return Explained - The metric built on distributable cash flow
- DSCR Formula and Lender Requirements - How lenders read the same cash flow
- How to Build a Real Estate Proforma - Constructing the full multi-year projection
- CRE Loan Types Explained - The debt structures that set the debt service line
Explore Solsten
- Commercial Real Estate Cash Flow Software - Annual and monthly statements, debt from loan schedules, actuals after closing
- CRE Proforma Software - The full projection engine behind the statement
- Plans and Pricing - Free for one property; $99/mo for five
Frequently asked questions
- What is the formula for cash flow in commercial real estate?
- Cash flow before tax equals net operating income minus annual debt service minus reserve contributions and other below-the-line capital items. NOI itself is effective gross income (potential gross income less vacancy and credit loss, plus recovery and other income) minus operating expenses. Cash flow after debt service is the lender-facing version; adjusted cash flow for distribution, after reserves and capital calls, is the investor-facing version.
- What is the difference between NOI and cash flow?
- NOI is the property's income after operating expenses and before any financing. Cash flow is what remains after debt service, reserves, and capital items. NOI describes the building; cash flow describes the investment. Two buyers with different loans get the same NOI and different cash flow from the same building.
- What is a good cash flow for a commercial property?
- There is no universal number. Judge it as cash-on-cash return, which is cash available for distribution divided by total equity invested. Many investors treat roughly 8 percent as acceptable on a low-risk stabilized asset and expect more as risk rises; value-add deals can be negative during renovation and lease-up and higher afterward. The more useful test is whether cash flow stays positive in every year of the hold, including the years with lease rollovers and capital projects.
- Why does cash flow go negative in some months when the annual total is positive?
- Because expenses and income are lumpy. Property taxes are usually paid once or twice a year, insurance renews once, and a tenant's free-rent period removes income for specific months. The annual statement averages all of that away. A monthly statement shows the months where NOI drops below the loan payment, which is the cash the owner has to bring to the table.
- How do lenders look at cash flow?
- Through debt service coverage ratio: NOI divided by annual debt service. Most commercial lenders require 1.20x to 1.25x at closing and some require 1.35x or more for riskier property types. Lenders also look at debt yield (NOI divided by loan amount) and at projected DSCR in each year of the loan term, which is why a year-by-year cash flow projection is part of every credit memo.
- Does cash flow analysis include the sale of the property?
- Operating cash flow does not; it covers the hold period only. Total return analysis adds the reversion: the sale price at the exit cap rate, less selling costs and the loan payoff. IRR and equity multiple use both operating cash flow and the reversion. Cash-on-cash uses operating cash flow only, which is why the two sets of metrics can disagree about the same deal.
Try Solsten Free
See everything we discussed in action — no credit card required.
Start Your Free AnalysisRelated Articles

How to Build a Real Estate Proforma: Step-by-Step Guide
Learn how to build a commercial real estate proforma from scratch — revenue projections, expense modeling, NOI, debt service, cash flow, and return metrics explained with examples.

What Is a T12 in Real Estate? How to Read a T-12 Report
A T12 is twelve months of a property's actual income and expenses. How to read a T-12 report line by line, spot red flags, and turn it into your underwriting.

How to Calculate Operating Expenses for Commercial Real Estate
A complete guide to CRE operating expenses — categories, fixed vs. variable, below-the-line items, and how expense modeling affects your NOI, DSCR, and investment returns.